
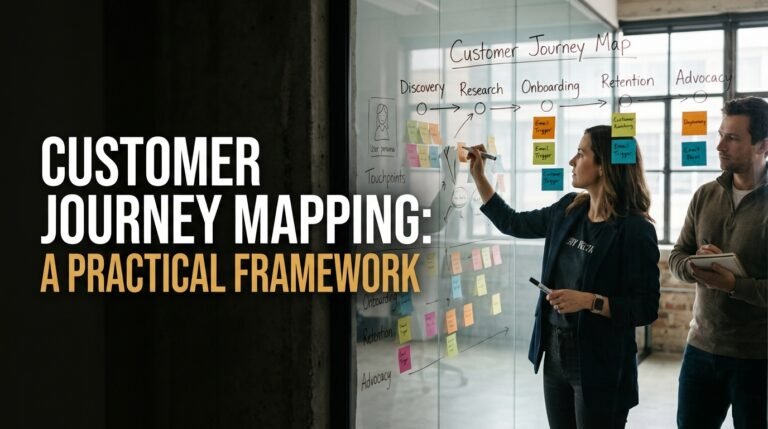
Every interaction a customer has with your brand forms an impression—from the first targeted ad they scroll past to the email receipt they receive post-purchase. Yet, in many organizations, departments manage these touchpoints in isolation. Marketing obsesses over click-through rates, sales tracks demo conversions, product optimizes onboarding metrics, and customer support monitors ticket resolution times.
When teams operate in silos, the customer experiences the cracks: fragmented messaging, repetitive requests for account details, confusing handoffs, and unexpected friction.
A customer journey map (CJM) bridges these operational divides. Far from being a decorative graphic or an abstract UX exercise, an effective journey map is an operational blueprint. It documents the end-to-end experience from the customer’s viewpoint, exposing the friction points, emotional valleys, and operational blind spots that drain revenue and undermine loyalty.
1. Anatomy of an Effective Customer Journey Map
Before drafting a map, you need to understand the structural layers that make it actionable. A superficial journey map records only what a customer does; an operational journey map captures why they do it, how they feel, and what systems support the interaction.
+-----------------------------------------------------------------------------------+
| STAGES: Awareness  -->  Consideration  -->  Decision  -->  Retention  -->  Advocacy |
+-----------------------------------------------------------------------------------+
| 1. Customer Goals & Jobs to Be Done                                               |
| 2. Touchpoints & Channels (Web, Email, App, Sales Rep, Support)                   |
| 3. Customer Actions & Thought Process                                             |
| 4. Emotional Arc (Delight / Uncertainty / Friction)                               |
| 5. Pain Points & Bottlenecks                                                      |
| 6. Operational Systems & Internal Ownership (Behind-the-Scenes)                  |
| 7. Key Performance Indicators (KPIs)                                              |
+-----------------------------------------------------------------------------------+
The Core Layers
- Customer Stages: The high-level phases of the relationship, typically spanning Awareness, Consideration, Decision, Onboarding, Retention, and Advocacy.
- User Goals & “Jobs to Be Done”: The underlying objective driving the user forward at each stage. A buyer does not wake up wanting to schedule a software demo; they want to automate a tedious weekly reporting chore.
- Touchpoints & Channels: The exact touchpoints where interaction occurs (e.g., social ads, pricing tables, checkout forms, automated verification emails, chat widgets).
- Customer Actions & Perceptions: The chronological steps taken and the internal narrative running through the user’s mind (e.g., “Why do they need my credit card before showing me a live demo?”).
- Emotional Arc: The qualitative sentiment curve—tracking transitions between confidence, confusion, frustration, and relief across time.
- Friction Points & Failure States: Where the journey breaks down, takes too long, or fails to deliver on user expectations.
- Internal Ownership & Backstage Processes: The underlying teams, API connections, third-party tooling, and database events that power or bottleneck each step.
- Metrics & KPIs: Quantitative guardrails measuring success at each transition point (e.g., bounce rate, time-to-first-value, churn, CSAT).
2. A 5-Phase Framework for Building a Practical Map
Building a resilient journey map requires balancing quantitative behavioral analytics with direct qualitative customer feedback.
Phase 1: Define Scope and Build Data-Backed Personas
Mapping “the customer journey” in aggregate produces vague, unhelpful artifacts. A mid-market B2B procurement officer follows an entirely different route than an end-user developer signing up via self-serve product-led growth (PLG).
- Select a specific persona: Narrow the focus to one target segment at a time.
- Define the journey boundaries: Decide whether you are mapping the entire lifecycle (end-to-end) or zeroing in on a critical transition, such as new user onboarding (day 0 to day 30).
- Ground your assumptions in real data: Avoid defining personas around superficial demographics. Anchor them in observed behavior, purchasing authority, and immediate pain points.
Phase 2: Gather Quantitative and Qualitative Evidence
Avoid filling your map with internal guesswork. The most common pitfall is diagramming the path leadership thinks users take, rather than reality. Combine two primary data streams:
| Data Stream | Key Sources | What It Uncovers |
| Quantitative Data | Google Analytics, Mixpanel, Amplitude, CRM event logs, Heatmaps | Drop-off rates, time spent per stage, bounce rates, navigation loops, abandoned steps. |
| Qualitative Data | Customer interviews, exit-intent surveys, CSAT/NPS notes, support tickets | Root causes of confusion, hidden workarounds, emotional friction, unmet expectations. |
Pro Tip: Spend an hour reviewing your company’s latest 50 customer support tickets and live chat logs. The recurring complaints, bugs, and points of confusion you discover will form the backbone of your map’s friction layer.
Phase 3: Map the End-to-End Stages and Touchpoints
Outline the sequence of actions chronologically. Break them down into distinct steps, capturing the user’s inner thoughts and physical touchpoints.
Stage 1: Awareness & Trigger
- Customer Objective: Address an emerging problem or fulfill an urgent operational need.
- Touchpoints: Search results, organic social posts, industry podcasts, peer recommendations, paid ads.
- Key Question: How does the customer discover your brand without feeling pitched?
Stage 2: Consideration & Evaluation
- Customer Objective: Validate whether your solution fits their requirements, budget, and workflow.
- Touchpoints: Product comparison pages, technical documentation, customer testimonials, interactive demos, pricing tiers.
- Key Question: Does your content answer critical buying objections clearly and transparently?
Stage 3: Decision & Purchase
- Customer Objective: Complete the transaction or sign the agreement with minimal friction.
- Touchpoints: Checkout flow, contract negotiation, security compliance reviews, payment gateway.
- Key Question: Are hidden fees, complex sign-up forms, or unexpected terms causing cart abandonment?
Stage 4: Onboarding & First Value (Activation)
- Customer Objective: Achieve the core outcome promised during the sales process as quickly as possible.
- Touchpoints: Welcome emails, setup wizards, initial dashboard view, customer success check-ins.
- Key Question: How long does it take for the customer to reach their initial “Aha!” moment (Time-to-Value)?
Stage 5: Retention, Expansion & Advocacy
- Customer Objective: Achieve continuous, reliable value, resolve unexpected issues, and scale usage.
- Touchpoints: In-app release notes, regular check-ins, knowledge base articles, referral incentives.
- Key Question: Are you proactively helping the customer succeed, or only reaching out when renewal time approaches?
Phase 4: Identify Emotional Dips and Hidden Bottlenecks
Once the timeline is established, trace the user’s emotional baseline:
- Valleys of Despair: Identify where frustration spikes. Frequent culprits include mandatory account creation before seeing pricing, slow website performance, broken password resets, or delayed customer support responses.
- Moments of Truth: Critical moments where a user decides whether to continue or abandon the service entirely (e.g., trying to export their first report or connecting their primary data source).
Phase 5: Translate Friction into Cross-Functional Ownership
A journey map is useless if it sits in a drawer as an inert diagram. Transform every identified problem into a concrete operational fix:
- Assign a single team owner (e.g., Product, Engineering, Marketing, Support) to each identified friction point.
- Establish a tracking metric (e.g., Reduce Day-7 Onboarding Drop-off by 15%).
- Schedule recurring reviews to track how changes made in production alter the user experience.
3. Real-World Journey Map: B2B SaaS Workflow
The following table demonstrates how a mid-market B2B software company maps its journey through the critical decision and onboarding stages:
| Dimension | Consideration Phase | Decision & Purchase | Onboarding (Days 1–14) | Ongoing Retention |
| User Goal | Compare feature parity against legacy solutions. | Secure budget and complete sign-up. | Connect existing data and train the core team. | Automate routine tasks and track ROI. |
| Touchpoints | Interactive product tour, pricing page, feature comparison table. | Self-serve billing form, automated receipt, welcome email. | Onboarding checklist, API key generation, kickoff call. | In-app dashboard, monthly digest email, support chat. |
| Customer Mindset | “Is this truly easier to use than my current setup?” | “Will our team actually adopt this, or is it shelfware?” | “This configuration is taking longer than advertised.” | “We rely on this daily and see clear value.” |
| Emotional State | Curious, skeptical. | Anxious, cautious. | Frustrated during setup, relieved upon completion. | Confident, satisfied. |
| Identified Pain Point | Pricing tiers omit user seat minimums, forcing demo calls. | Credit card billing fails on international corporate cards. | API documentation lacks practical code snippets. | Feature update emails go to spam filters. |
| Internal Owner | Marketing & Revenue Operations. | Billing & Engineering. | Developer Relations & UX Design. | Product Marketing & Customer Success. |
| Impact Metric | Demo-to-Trial conversion rate. | Checkout completion rate. | Time-to-First-Value (TTFV). | Monthly Active Users (MAU) & Net Revenue Retention. |
4. Common Journey Mapping Pitfalls to Avoid
Even well-intentioned teams often run into common failure patterns:
- Mapping Internal Systems Instead of Human Experiences: Do not confuse your sales funnel with the customer journey. Your CRM pipeline stages (Lead, MQL, SQL, Opportunity) represent internal workflows, not the thoughts, feelings, and actions of the customer.
- Treating Journeys as Strict Linear Pipelines: Modern consumers do not follow neat, straight lines. They loop back, conduct research across multiple devices, read reviews while browsing, abandon carts, and re-engage weeks later via email. Design your map to account for loops, pauses, and alternative entry points.
- Leaving Front-Line Teams Out of the Process: Creating a map solely inside executive meetings leads to blind spots. Customer support agents, account managers, and community moderators interact with customers every day; their frontline input is vital.
- Creating a Static Document: A journey map is not a one-and-done project. Whenever you roll out a major redesign, update pricing models, or introduce new features, update your map to reflect the changes.
5. Turning Map Insights into Measurable ROI
To justify the investment in journey mapping, connect its findings directly to business outcomes:
- Prioritize the Highest-Impact Friction Points: Use an impact-versus-effort matrix. Quick wins—like refining confusing error messaging or streamlining an account creation form—can deliver immediate conversion gains while longer-term redesigns are underway.
- Unify Cross-Functional Teams Around Shared OKRs: Instead of assigning marketing a siloed acquisition target and product a separate engagement goal, tie team bonuses and milestones to seamless transitions across stages (e.g., Trial Sign-Up to First Core Action).
- Conduct Before-and-After Journey Audits: Benchmark customer sentiment (CSAT/CES) and baseline drop-off rates before deploying solutions, then measure the results 60 to 90 days later to assess performance.
When executed with discipline, customer journey mapping turns disjointed touchpoints into a cohesive, user-centered experience—transforming casual visitors into long-term brand advocates.